Performance, made easy.
Ads performance and Shopify orders in one simplified view, graded against your profit goals.
We’ll help connect your store, set your goals, and walk you through your numbers.
Example data.
More ads than ever. No easy way to read them.
Common Thread Collective, May 2026, across a study of 1M+ Meta ad creatives — 20+ new ads a month vs. fewer than 10.
In practice your account climbs into the hundreds of ads, with no easy way to tell which ones pay off. Reading the signal is the part we made easy.
Find the signal in hundreds of ads.
We look at every ad and spot the issues for you: carts that never convert, ads that get clicks but no carts, hidden gems that deserve more spend. So it's easier to tell if you have a product page issue, a cart and checkout issue, or a creative issue.
Example data.
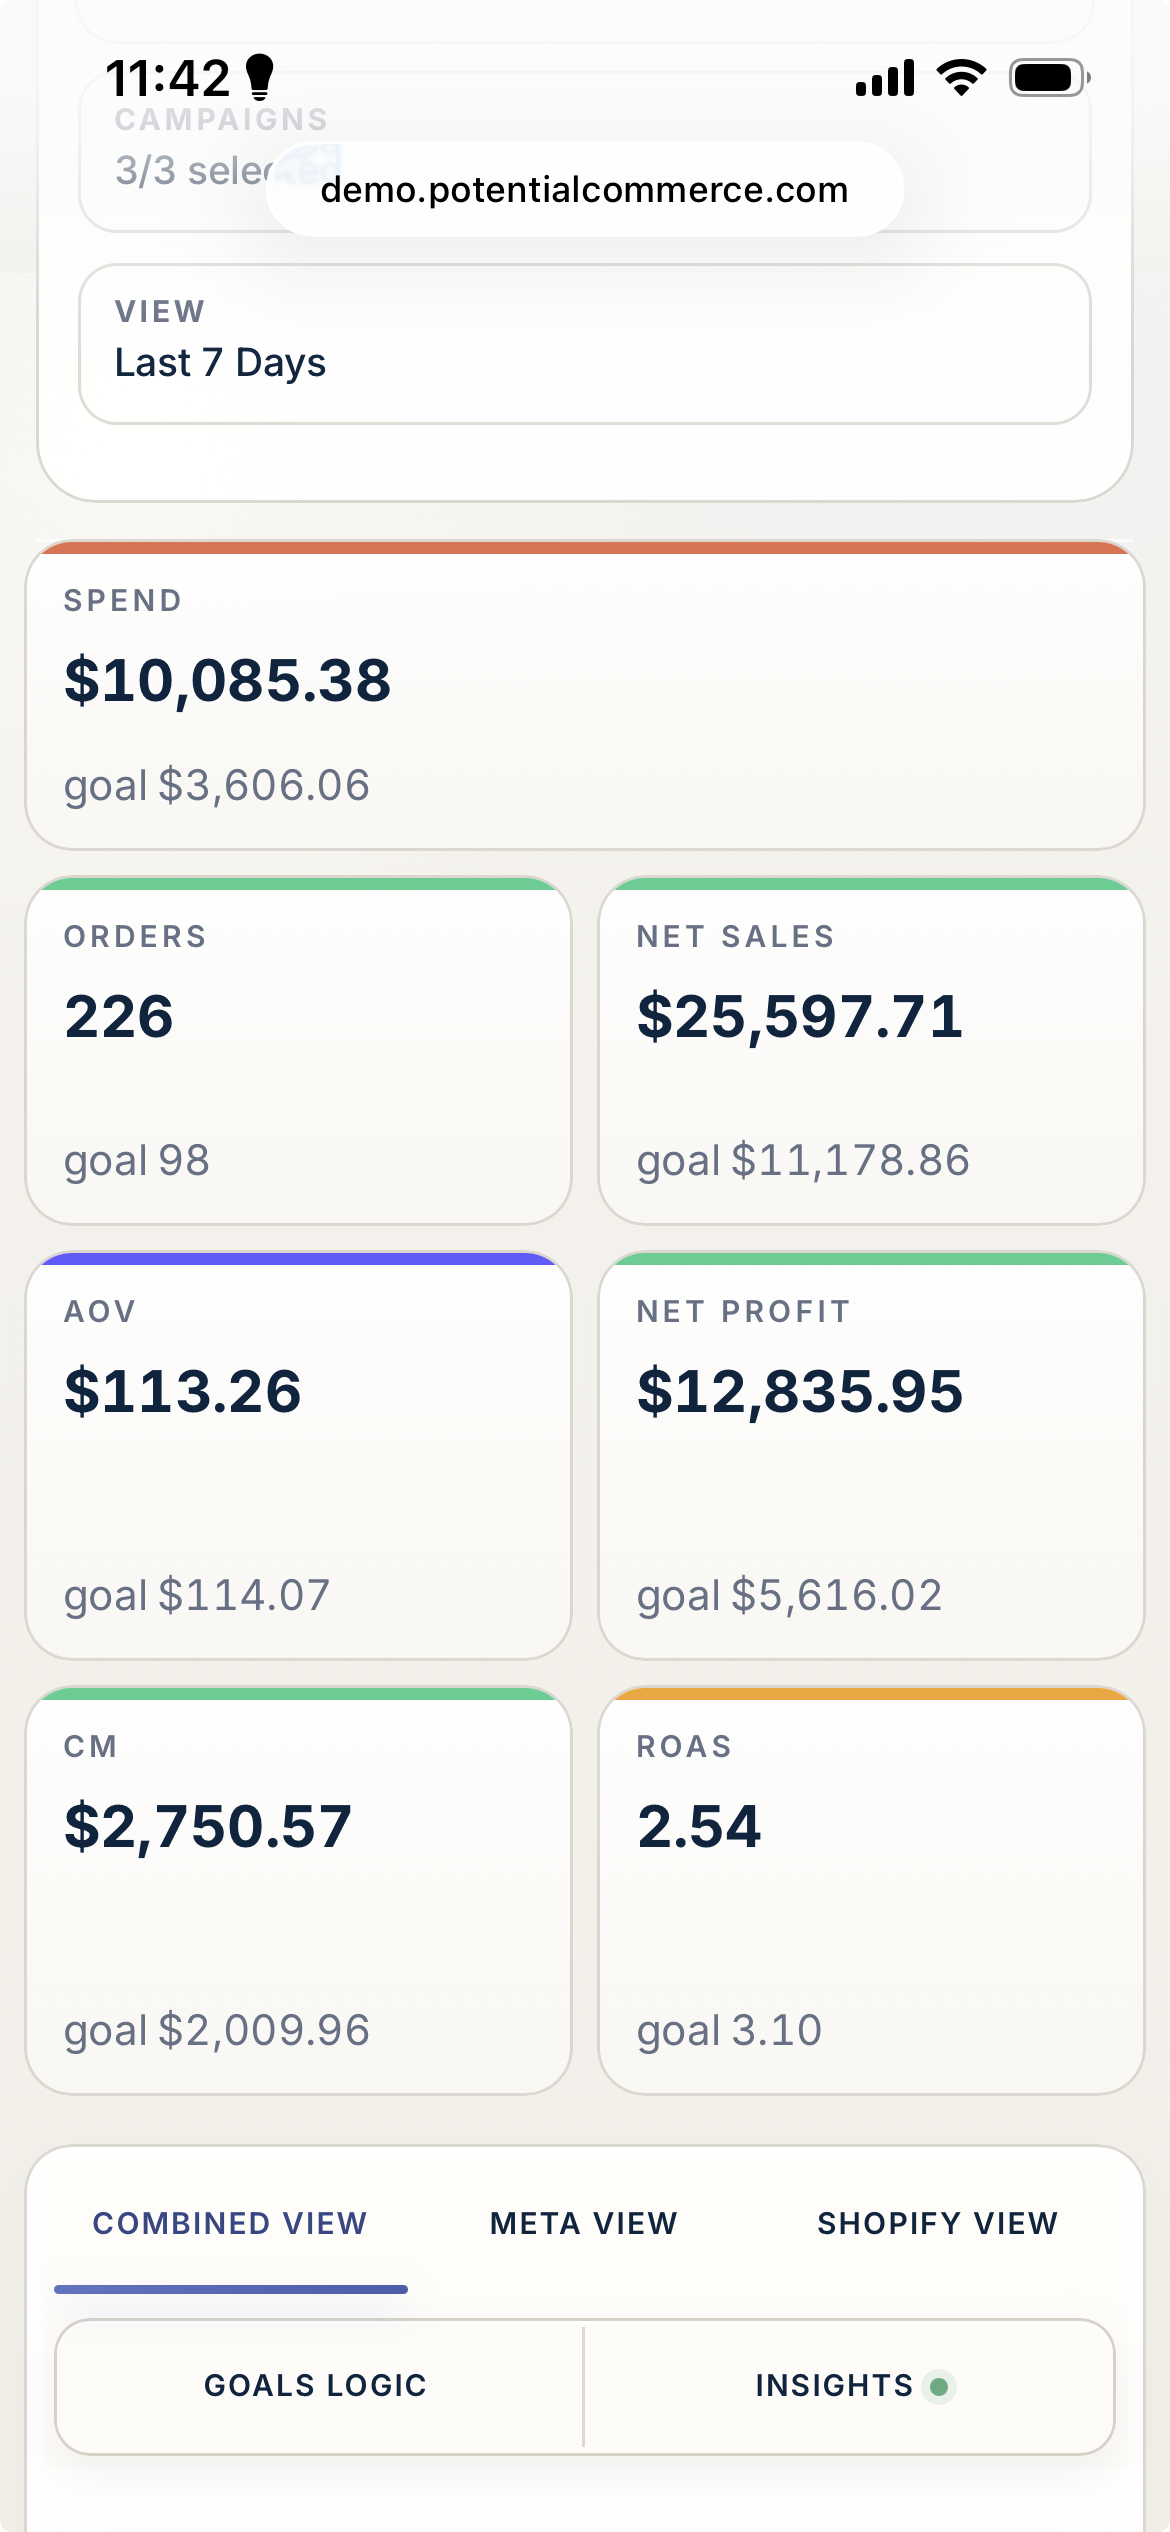
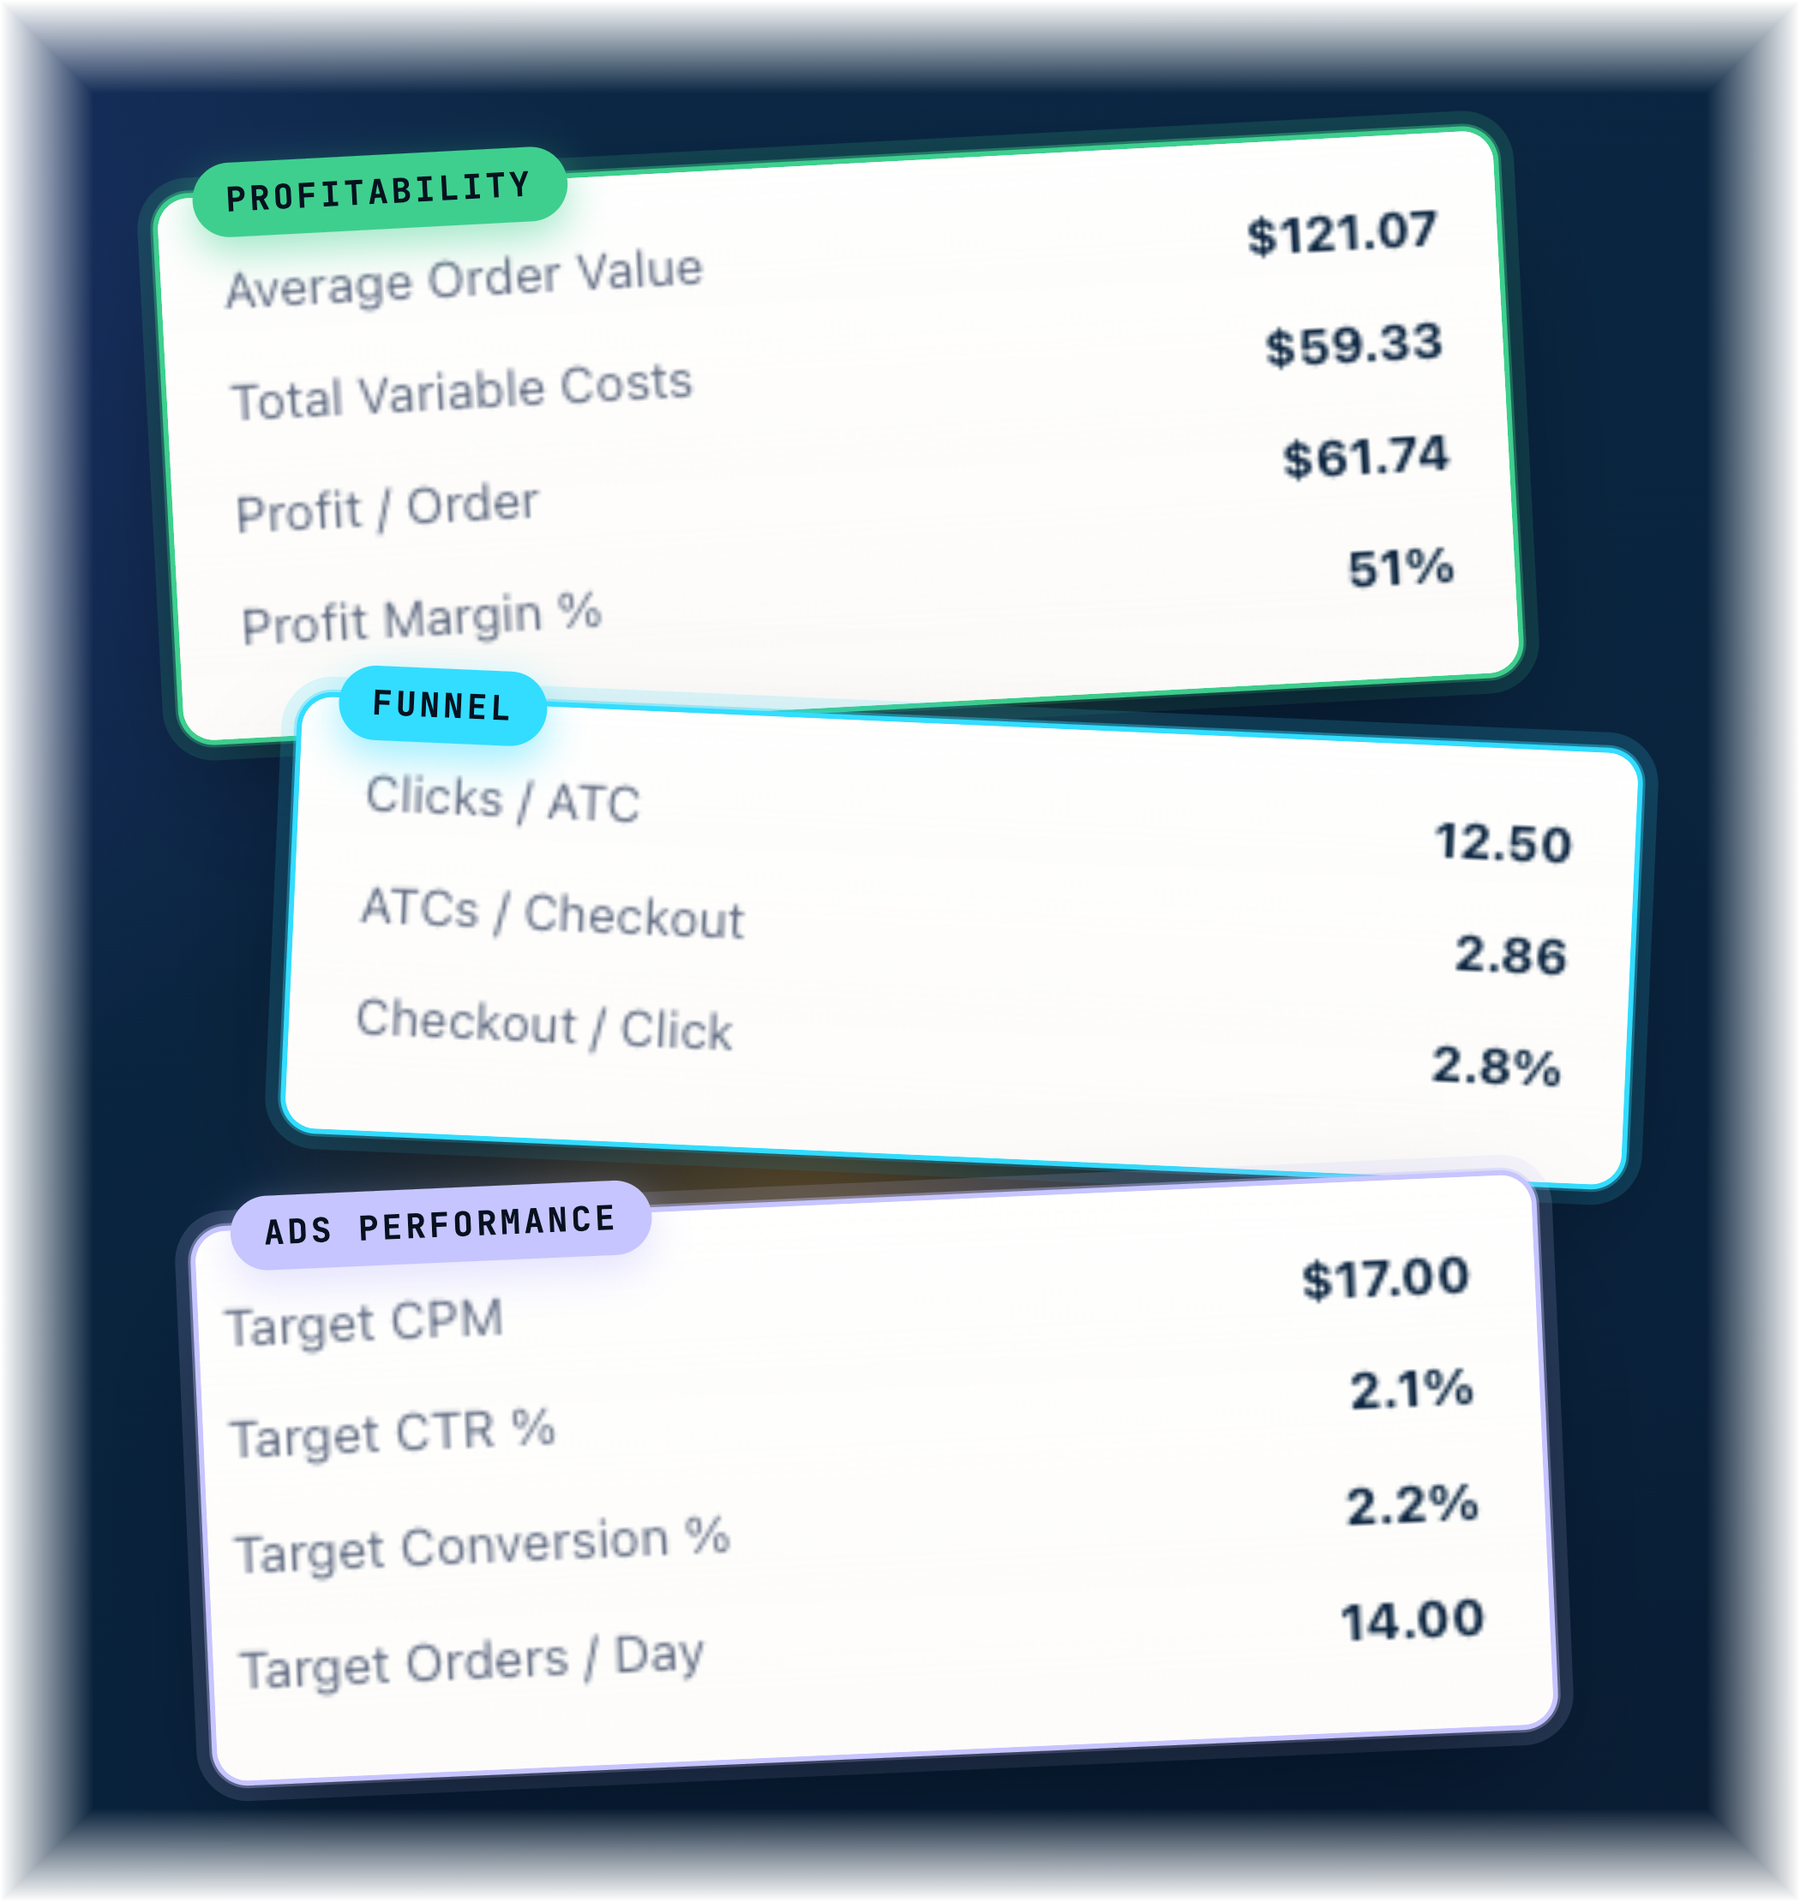
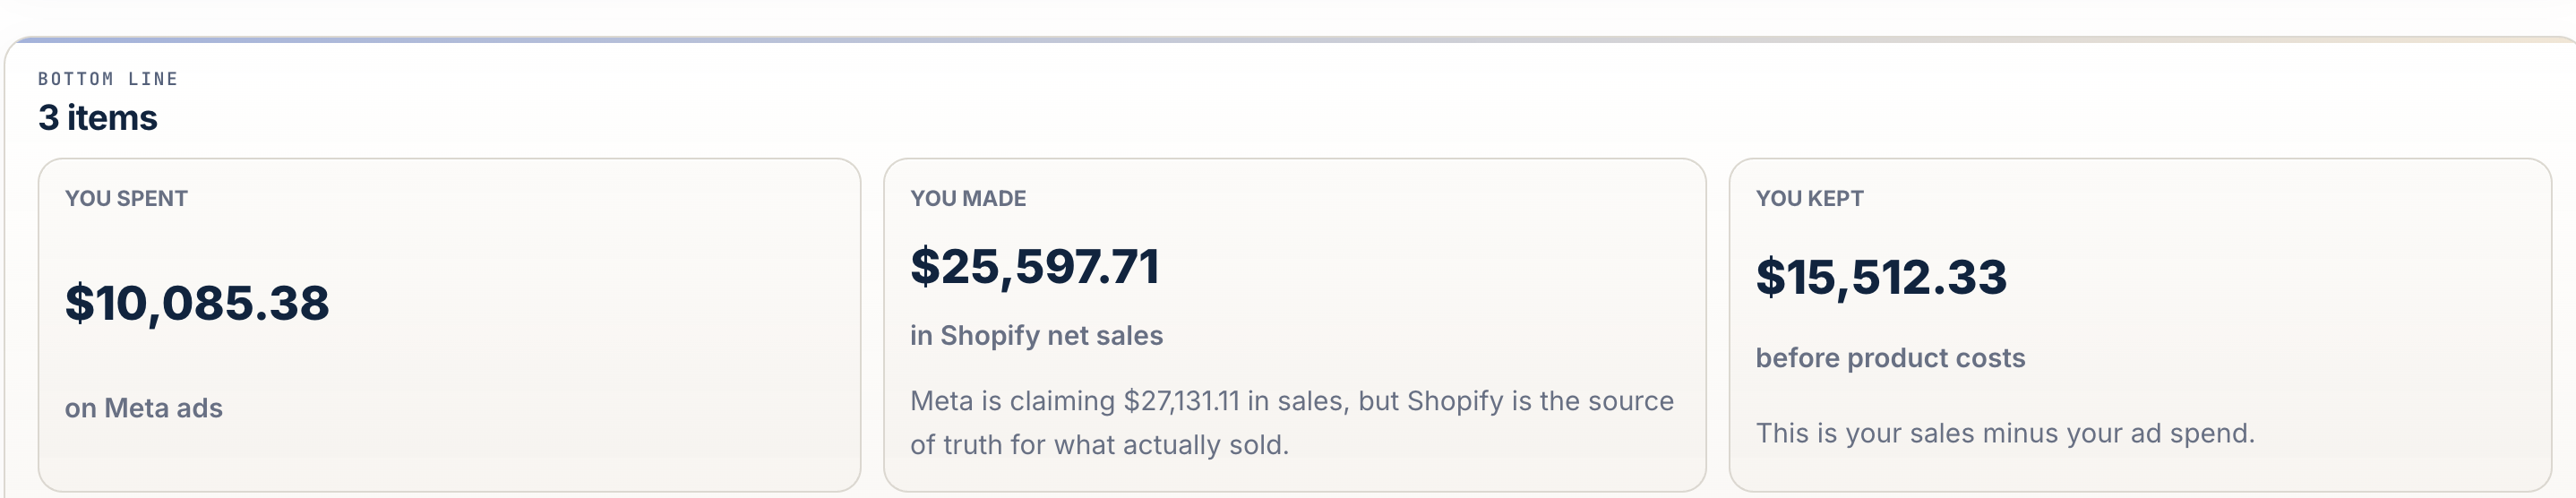
Know if your margins work before you spend.
Set your costs and margins once, and every ad gets the number it has to hit to turn a profit, tracked on Shopify's own attribution.
Example data.
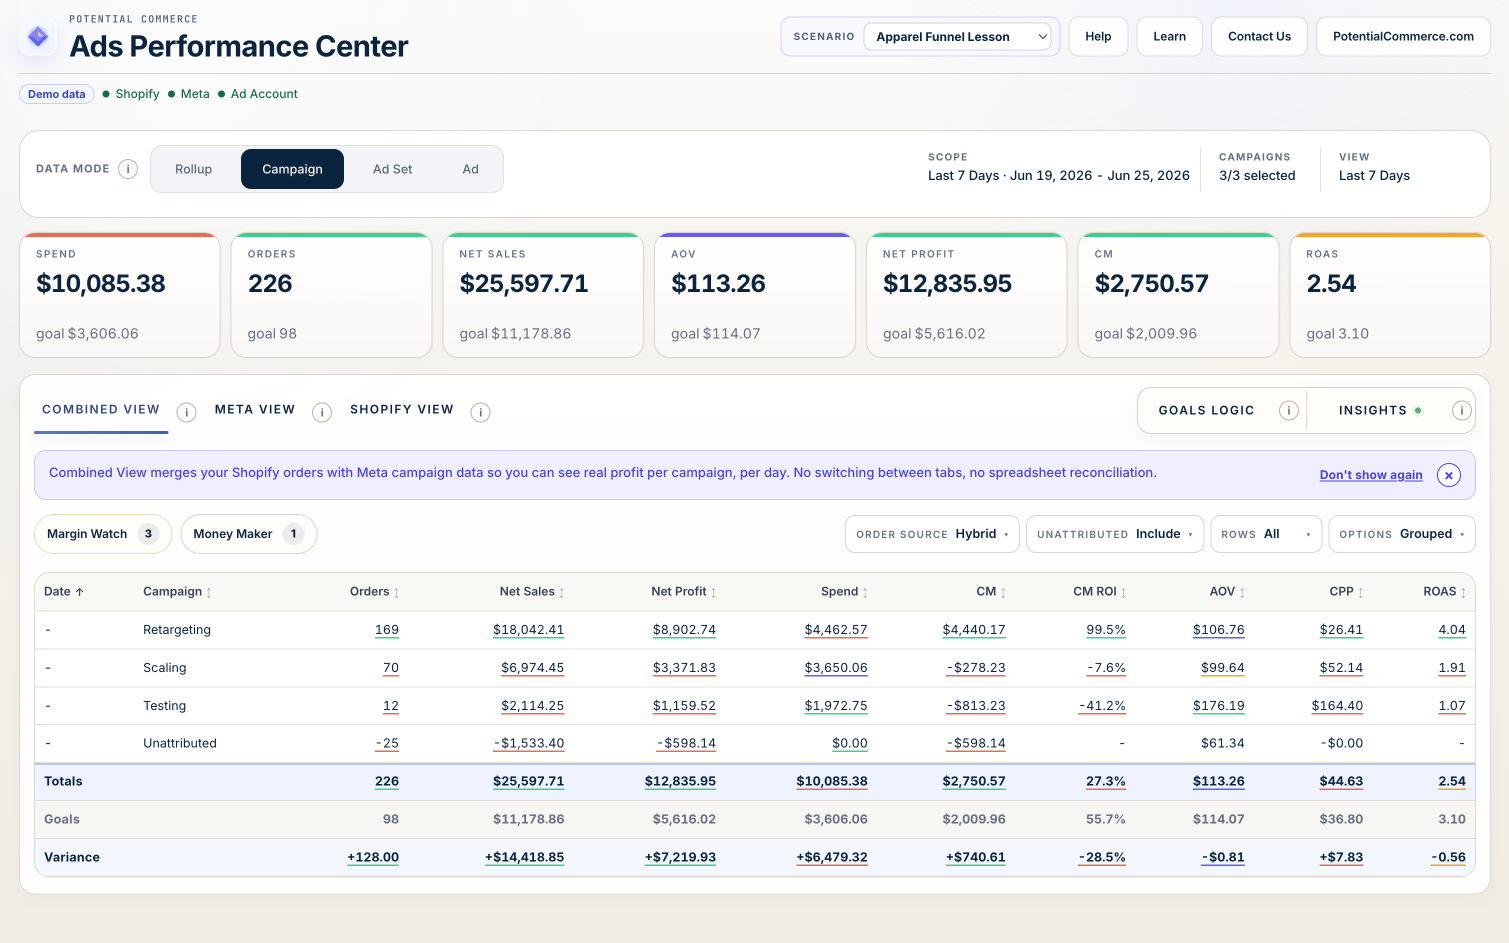
Understand your performance. No stats degree required.
Set how much you can afford to spend to get one order and how much profit you want to keep. Potential Commerce grades each ad against those goals, so you can quickly see what's working and what needs a closer look.
Your Meta ad results and actual Shopify orders sit side by side in one view, giving you the full picture without piecing together separate reports.
Example data.
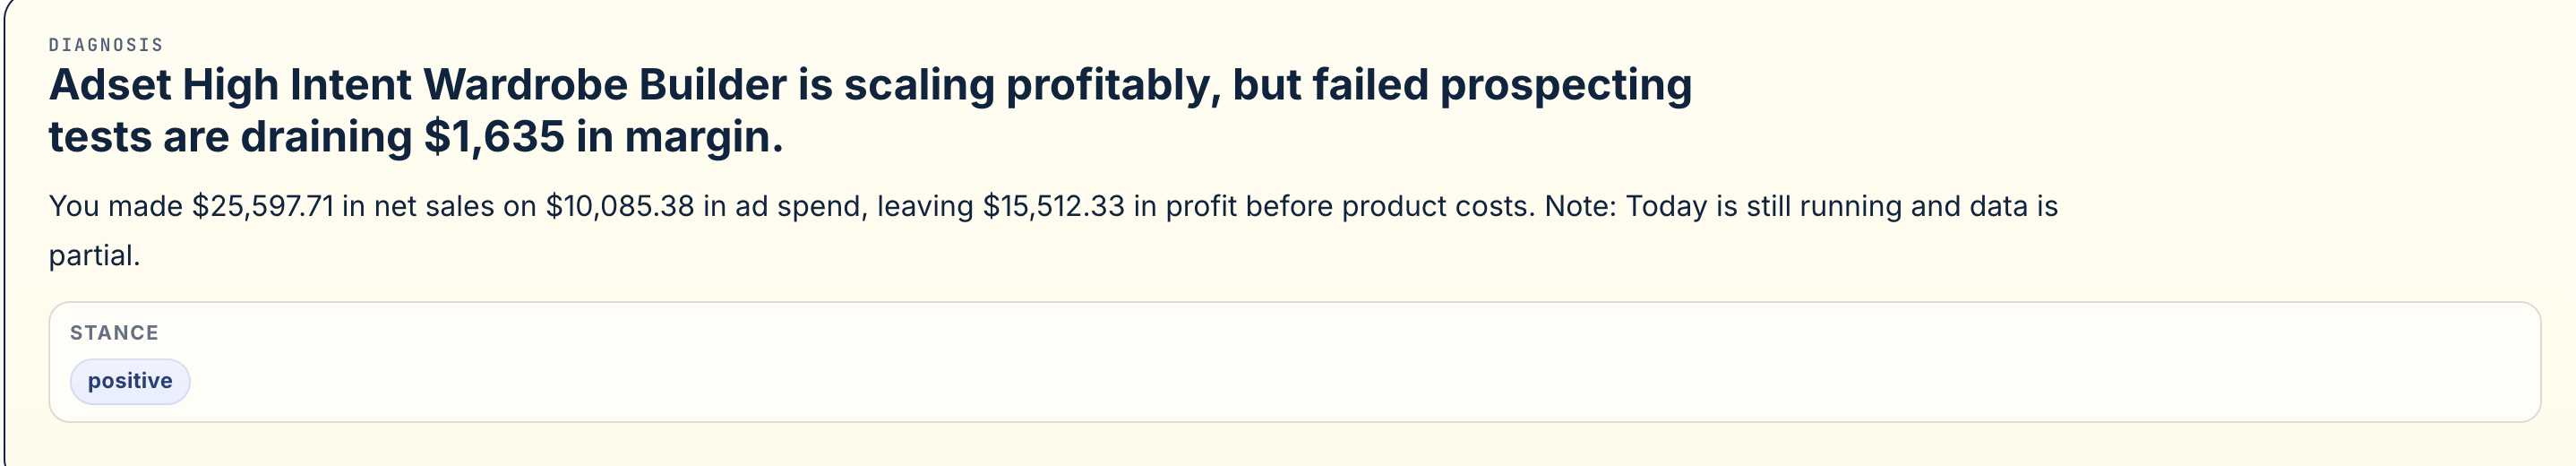
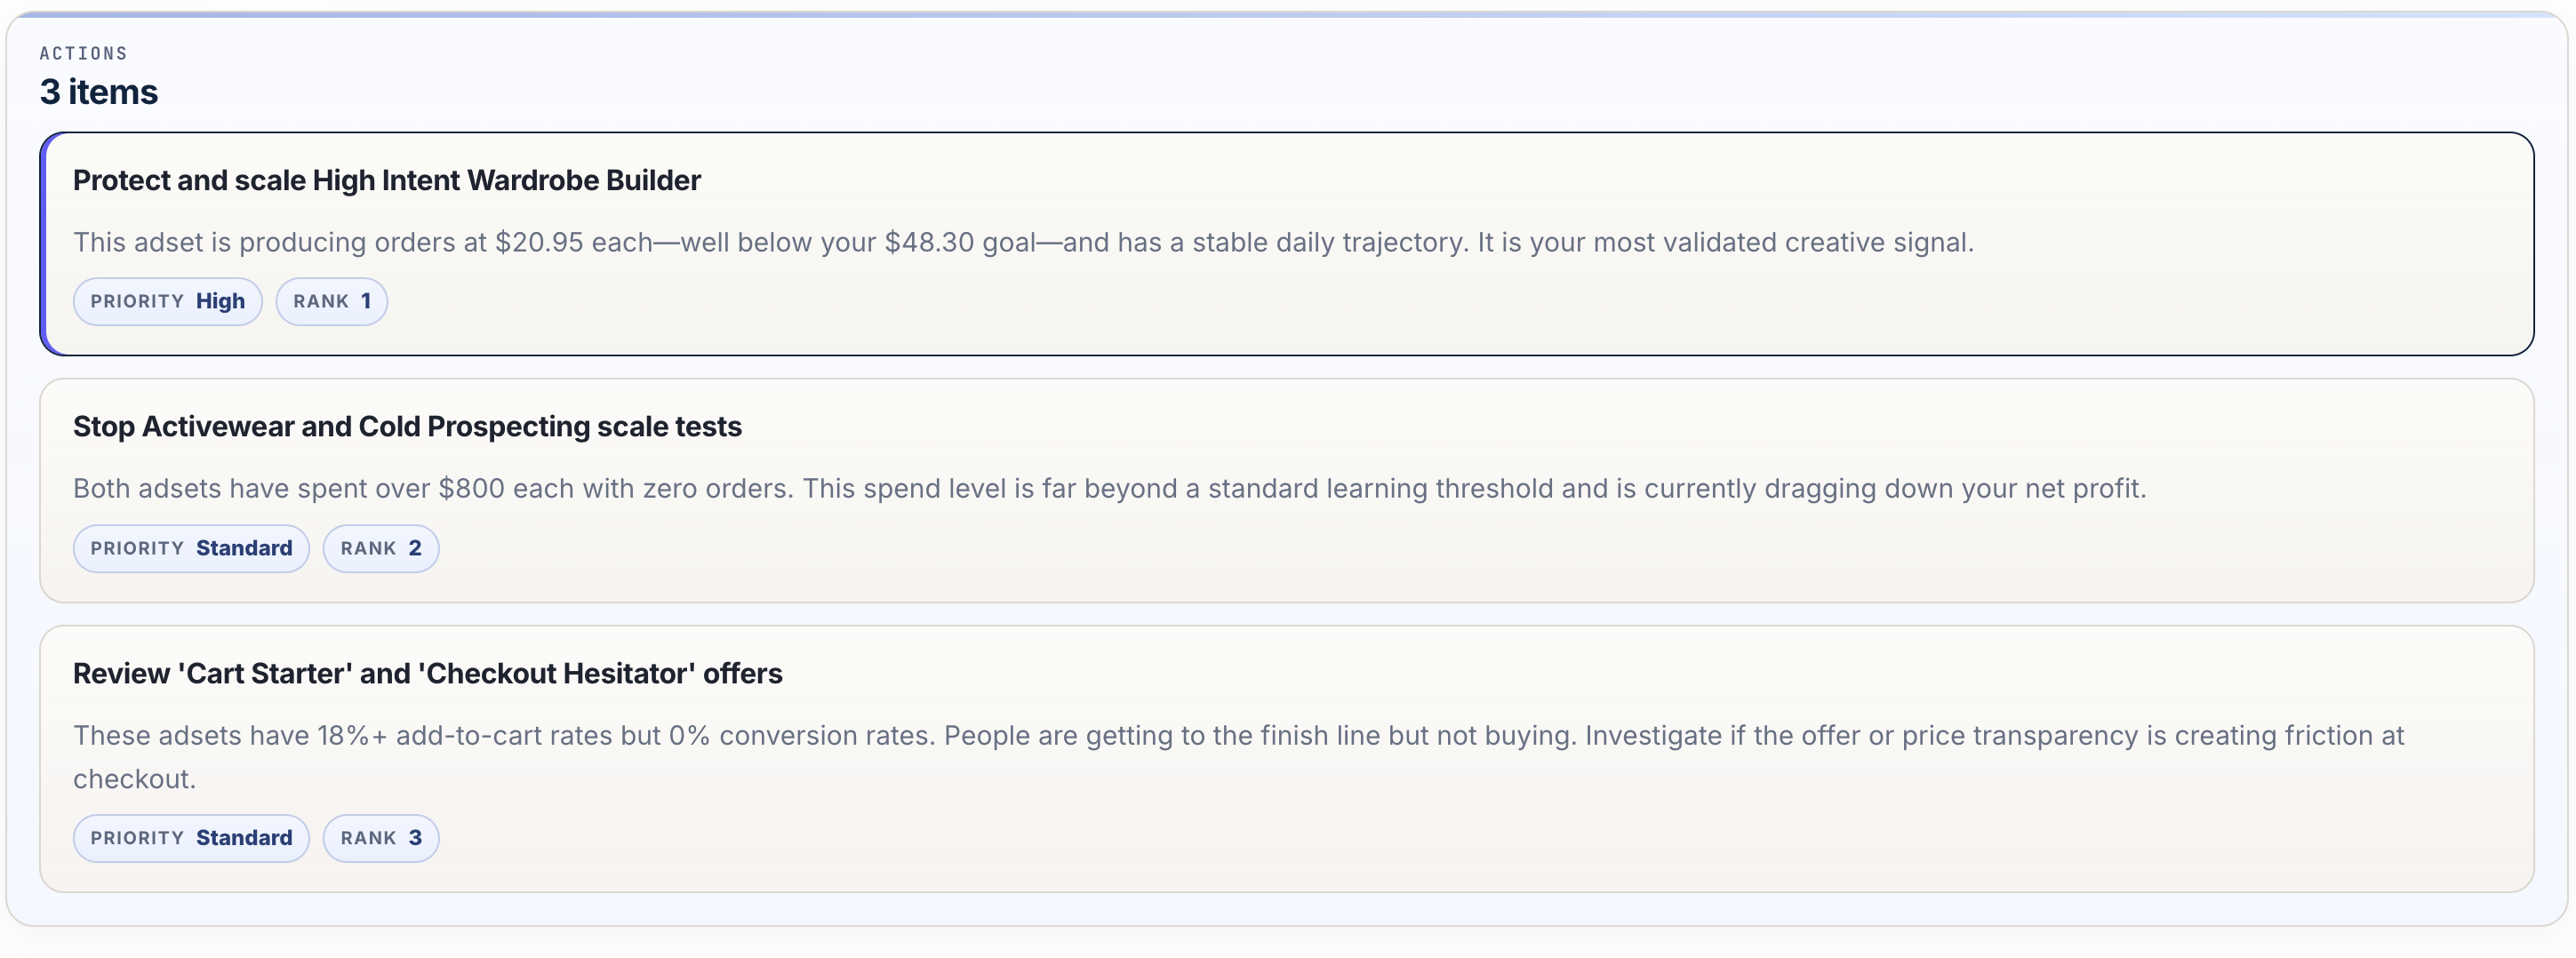
Get a senior buyer's read on what to do next.
An AI-assisted, plain English read on what's working, what each order is costing you, and which ads deserve a closer look. You make the call.
Example data.
From install to insight in minutes.
Install from the App Store
No theme code, no pixel setup, no developer needed.
Connect Meta
One authorization. Your campaigns appear.
Set your goals
Margins and targets, once. Every row grades itself in about 2 minutes.
There's no easy button for building a brand. But now there's one for analyzing ad performance.
You've scrolled past tools promising to make your ads for you, and courses promising to 10x your performance. We're not that. But reading what your ads actually did? That part we made easy.
We're new, so no wall of reviews yet. Don't take our word for it. Start the free trial on your real account and judge it on what it shows you.
We’ll help connect your store, set your goals, and walk you through your numbers.
Most tools do one thing. Your business isn't one thing.
Profit calculators
- Tell you what you kept…
- …but not which ads did it
- No read on creative or funnel
Creative strategy tools
- Creative-only view
- No profit truth from your store
- Another tab to reconcile
Ads Performance Center: all three, in plain English
- Ad & ad-set performance, plain English read
- Profit truth on Shopify's own attribution
- Creative signals plus a senior buyer's read to act on them
- One table, every row graded to your goals
- 2-minute install. No pixel setup. No code.
- $39/mo, everything included. No tiers, no gates.
Built to replace the hour a day you spend reconciling dashboards and spreadsheets. For less than $1.50 a day.
Quick questions
What does setup involve?
Install from the App Store, connect Meta, set your goals. No pixel, no code. Most stores see their graded table in about 2 minutes.
Whose attribution do you use?
Shopify’s — the actual orders your store received through Shopify. Meta and Shopify count conversions differently, so the two rarely match exactly, and that mismatch is one of the most confusing parts of running ads. We show both side by side, so you can see the gap and make decisions on your store’s own numbers.
Is this hard to install or remove?
No. Install from the Shopify App Store, connect Meta, and set your goals. We don’t require theme code or pixel installation, and you can uninstall from Shopify like any other app.
Does it tell me what to do, or just show data?
Both. Every metric is graded to your goals, and Insights reads your account like a senior buyer: verdict, evidence, and the next move. You make the call.
What does it cost?
$39/mo after a 7-day free trial. Everything included, no tiers, no per-order surcharges. Cancel anytime.
You’re new. Why should I trust it?
Fair question. No wall of reviews yet, but we run our own store on it every day. Start the free trial, point it at your real account, and judge it on what it shows you.
Performance, made easy.
Ads performance and Shopify orders in one simplified view, graded against your profit goals. Live in 2 minutes.
We’ll help connect your store, set your goals, and walk you through your numbers.