Make money on every order
Know what you really make on a sale, so you know what you can spend to get one.
Make money on every order
This guide shows you where the numbers live so you can build the model to make money on every order. Revenue and ROAS come from Meta; your costs (product, discounts, returns, shipping, payment fees) come from your store and your own records. You bring both together in Potential Commerce's Goal Editor. Setup first, then each input explained.
Works the same whether you're doing $5k a month or $1M. It's the first thing to set, before research, creative, or campaigns.
New to CPP, CM, ROAS, or ROI? Jump to what each metric means.
Set It Up In Potential Commerce
The model is one Goal Editor profile, built from four panels. Set it for a single offer first; more profiles can come later. Start to finish it takes about ten minutes.
To open the Goal Editor, go to your Ads Performance Center dashboard, click Goals Logic, then Edit Goals on the next screen.


Here is what each panel holds, in the order to fill them.
Profit Assumptions
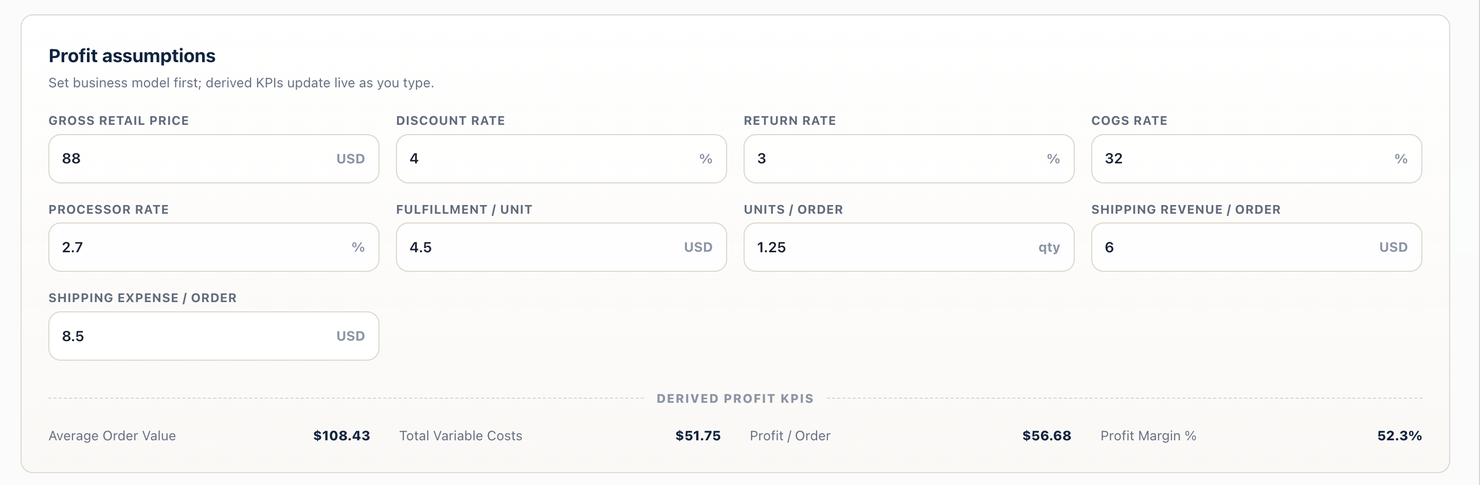
Gross retail price, discount rate, return rate, COGS rate, processor rate, fulfillment per unit, units per order, and shipping revenue and expense. The panel computes Profit per Order, what's left after the costs that move with each sale.
Store Funnel
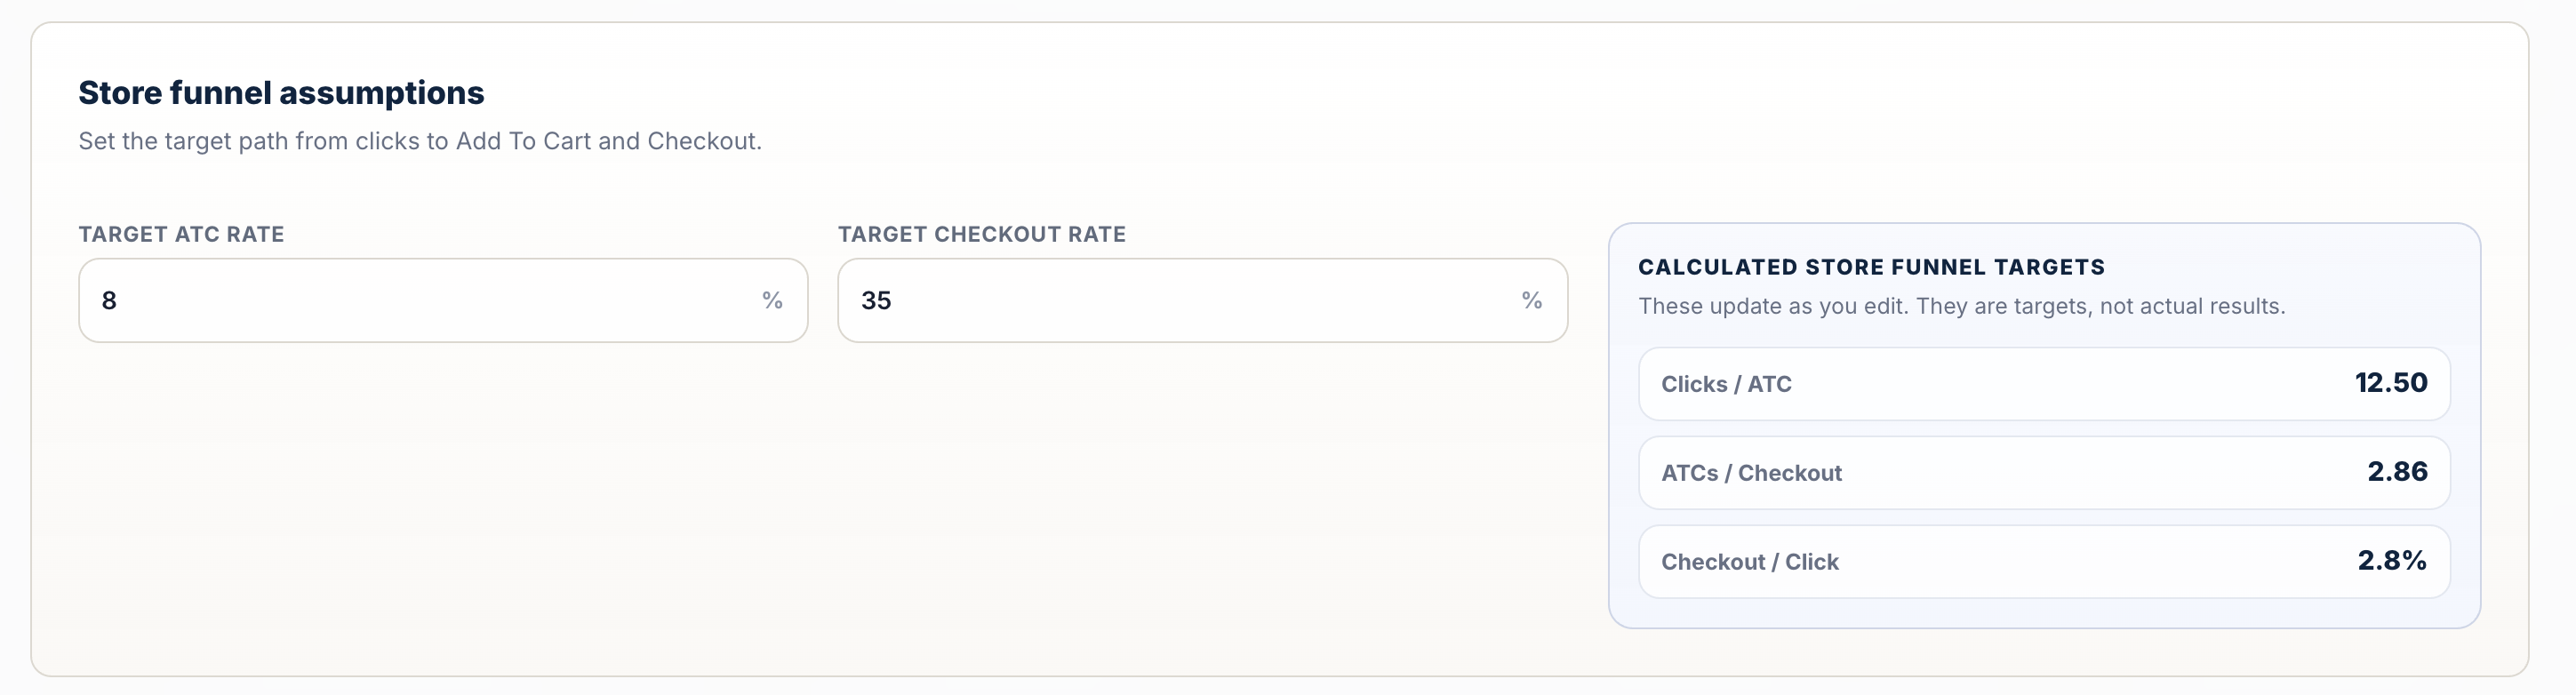
Target ATC Rate (clicks that add to cart) and Target Checkout Rate (carts that complete). The panel derives the click-to-order conversion rate, the number Meta delivery runs against.
Meta Assumptions
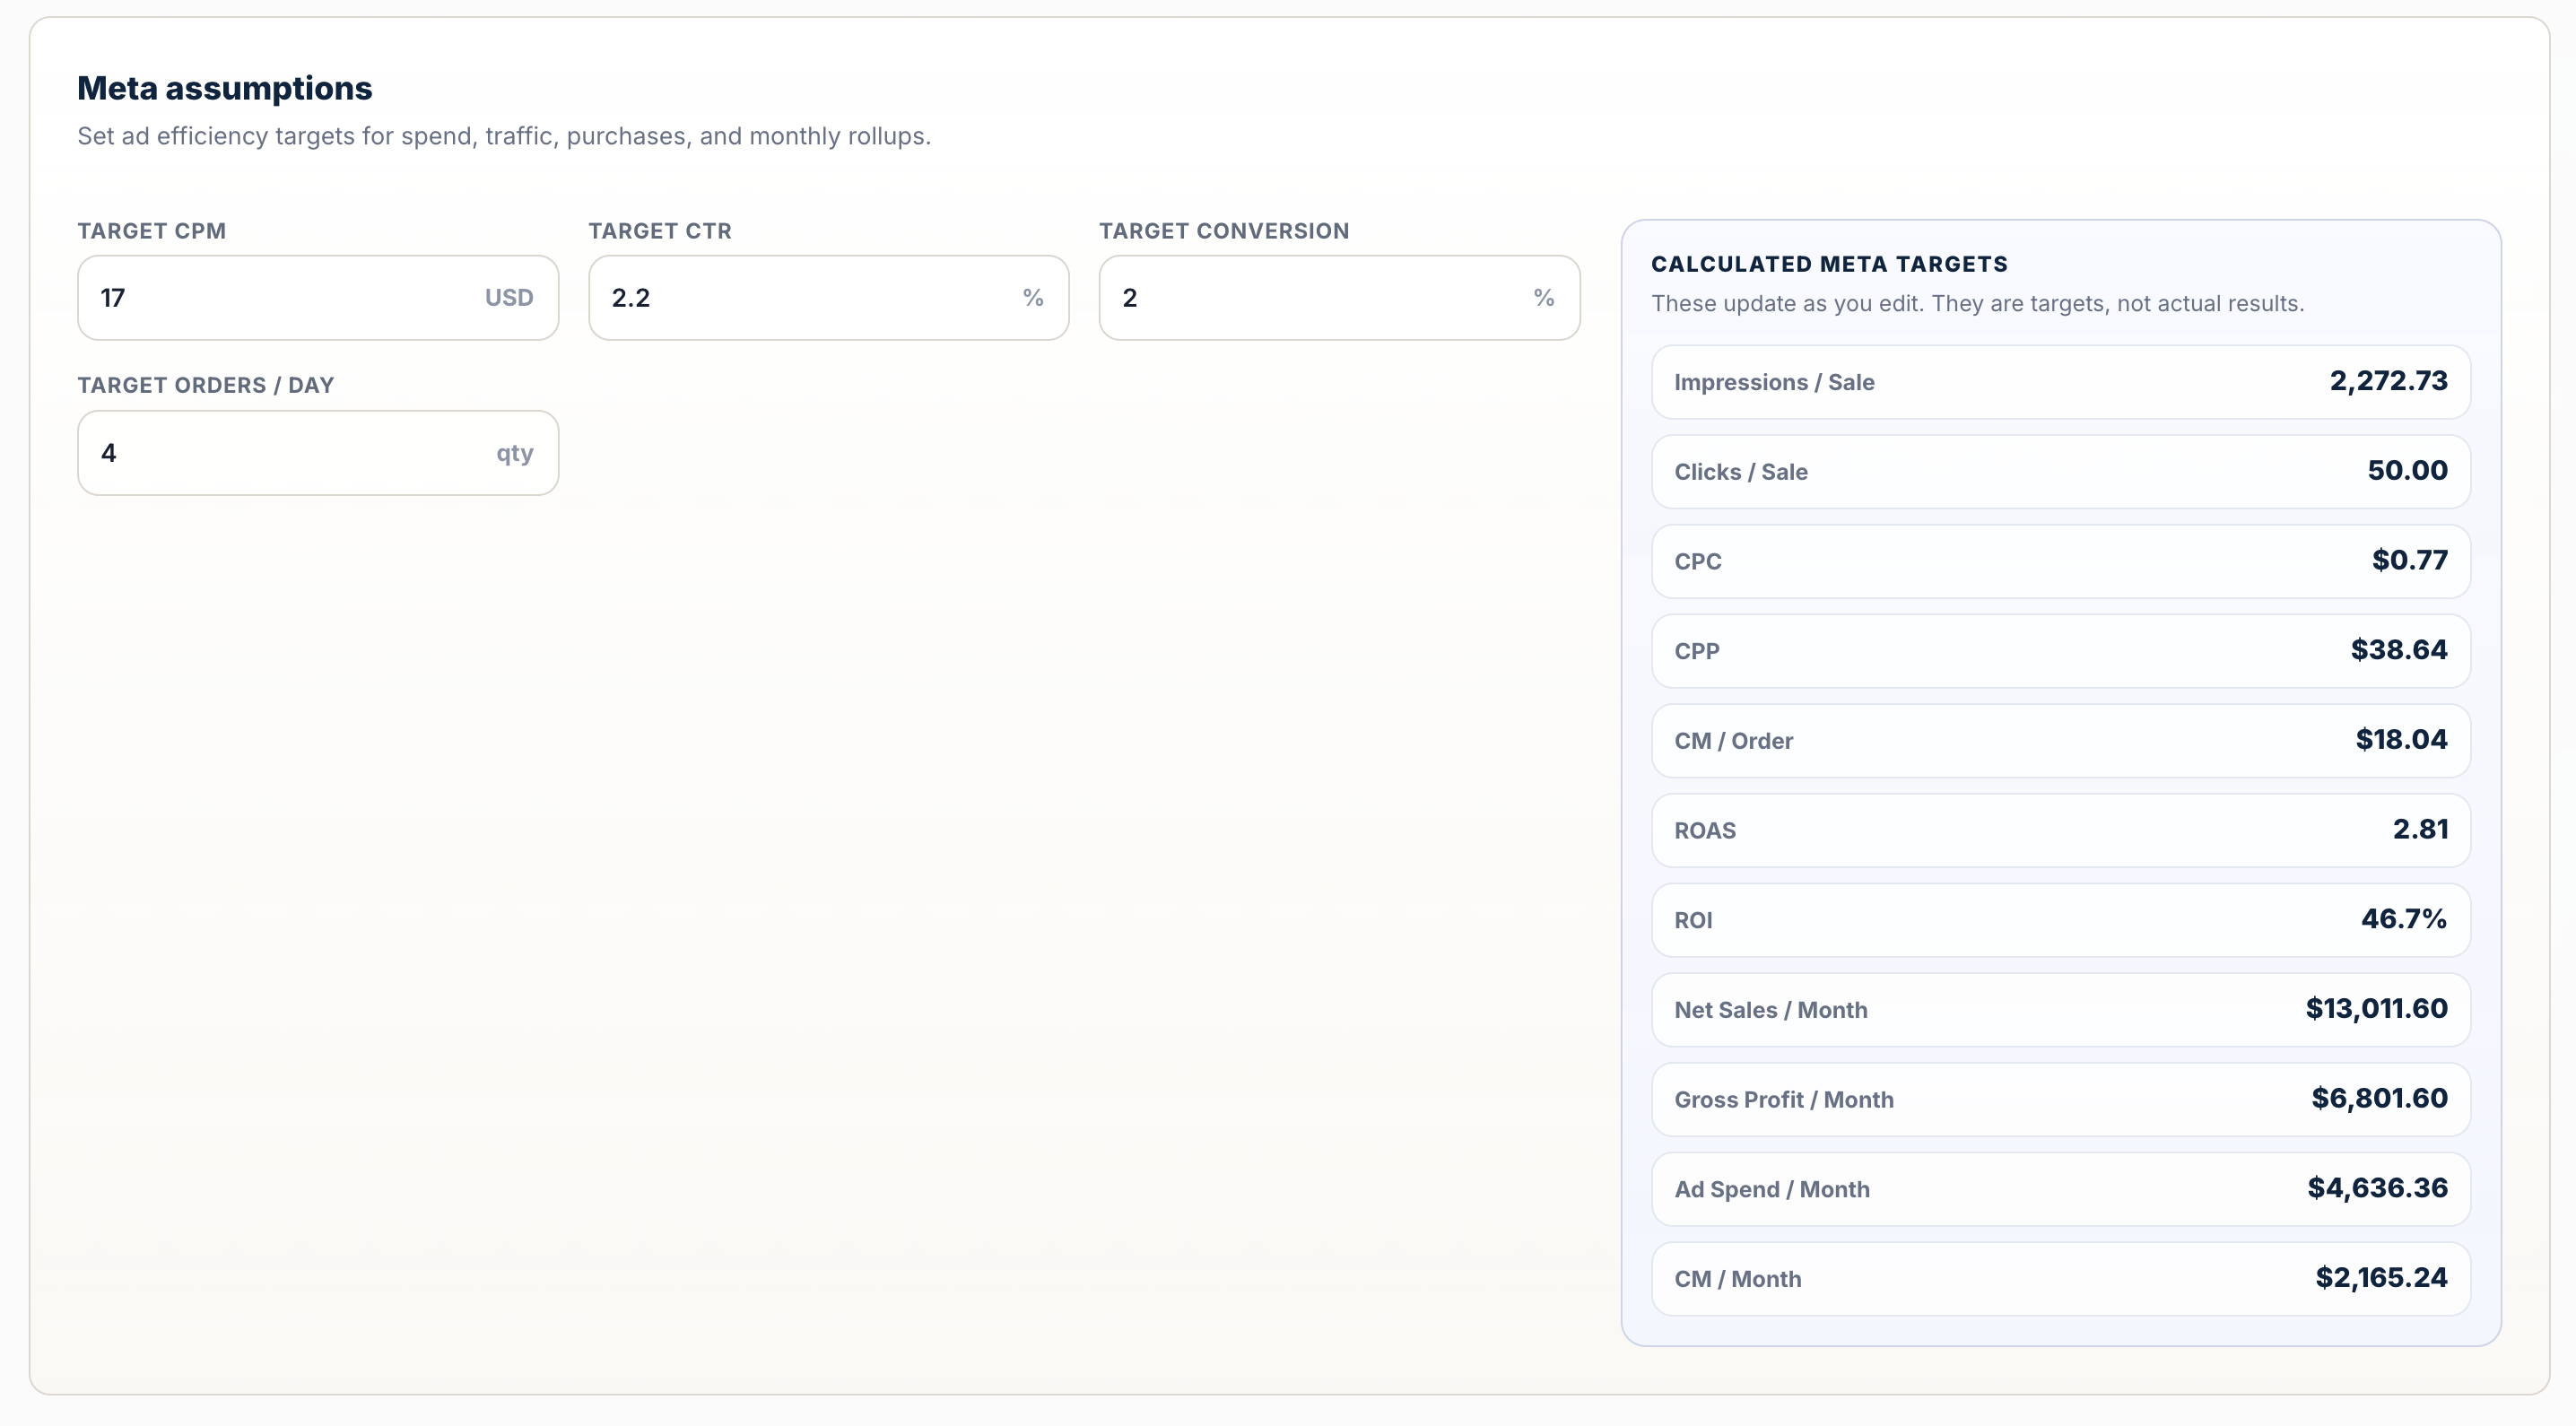
CPM, CTR, conversion (matching the funnel), and target orders per day. The panel derives CPP (cost per purchase), CM per order (Contribution Margin), ROAS, ROI, and monthly rollups. Confirm CPP is below Profit per Order, which keeps CM per order positive.
Evaluation Tolerance
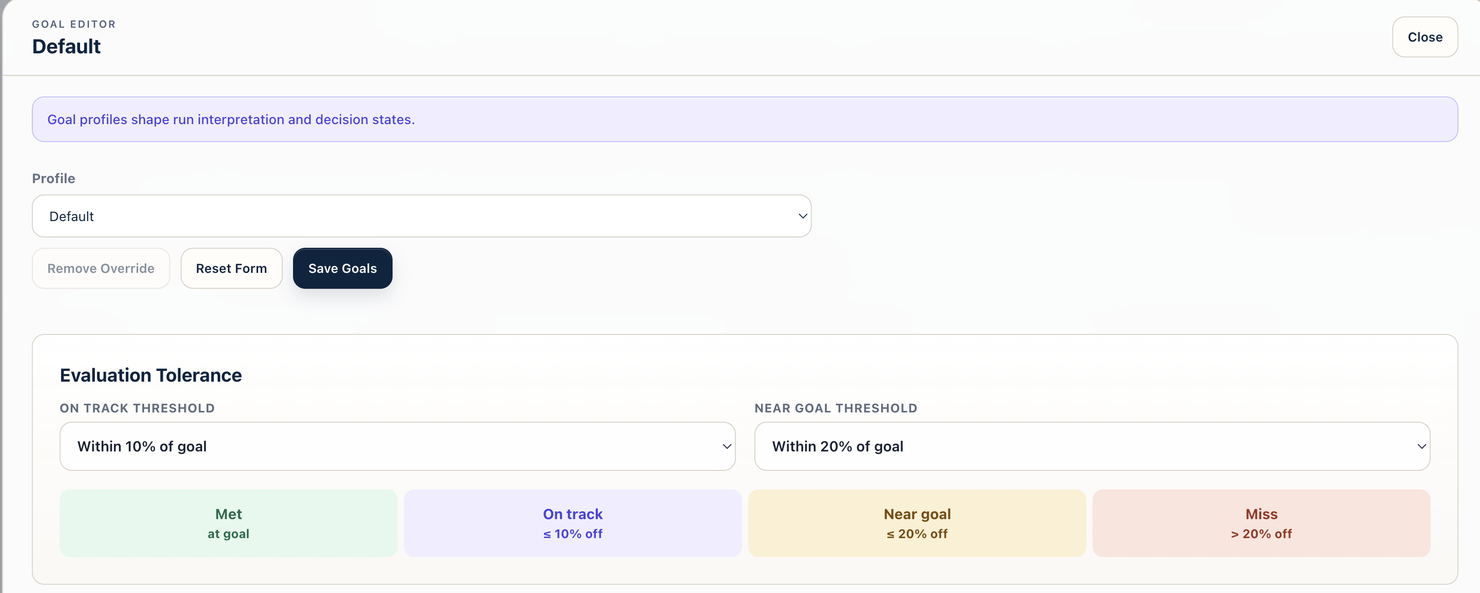
On-track (default 10%) and near-goal (default 20%) thresholds decide how a live result is graded against target. The defaults suit new offers and early campaigns.
The rest of this guide explains what each of those numbers means and how to choose it.
What An Order Is Really Worth
Profit per Order is what's left after every variable cost, before a dollar goes to ads. Variable costs are the ones that rise with each sale: product, payment processing, shipping, discounts, and refunds. Fixed costs (rent, software, salary) stay flat whether you sell one order or a thousand and sit on a different spreadsheet. The model tracks only the variable ones, on the logic that once each order clears them, volume covers the rest.
The Inputs
Pull these from the last 30 to 90 days of real store data.
| Input | What it means | Where to pull it from |
|---|---|---|
| Gross Retail Price | The list price before any discount. | Your product page. |
| Discount Rate % | The percentage of revenue you typically give away: site-wide promos, automatic discounts, coupon codes, bundles priced down. | Discounts divided by gross sales over your last 30-90 days. Shopify reports this directly. |
| Return Rate % | The percentage of revenue that comes back as a return or refund. | Refunds divided by net sales over the same window. Capture your returns. |
| COGS Rate % | What the product costs you to make or source, as a percentage of revenue. Manufacturer cost, raw materials, labor, customs, freight in. | Your supplier invoices. Per-unit cost divided by per-unit revenue. |
| Processor Rate % | Credit card and payment fees. Usually 2.4-3.0% depending on processor and card mix. | Shopify Payments / Stripe statement. |
| Fulfillment / Unit | The pick-and-pack cost per item: labor, packaging, the box, tissue paper, the thank-you card. | 3PL invoice or your own fulfillment cost. |
| Units / Order | Average items per order. Usually between 1.0 and 1.5 for early brands. Higher if you have a strong bundle or upsell. | Shopify analytics -> average units per order. |
| Shipping Revenue / Order and Shipping Expense / Order | What you charge for shipping vs. what it costs you. Many brands charge $5-7 and pay $8-11. The gap matters. | Shopify shipping report; your fulfillment carrier invoice. |
The Derived Numbers
| Derived metric | What it tells you |
|---|---|
| Average Order Value (AOV) | What an order is actually worth after discounts come out, returns come back, and shipping revenue is added in. Not the same as your list price times units per order. |
| Total Variable Costs / Order | Everything that scales with the sale (product cost, processor fees, fulfillment, shipping expense) rolled into one figure per order. |
| Profit / Order | AOV minus Variable Costs. What's left after every variable expense, before a dollar goes to ads. |
| Profit Margin % | Profit/Order divided by AOV. The percentage of every dollar of revenue that survives variable costs. |
A Worked Example
A beauty-brand profile: a hydrating serum, one product, light discounting, low returns.
Inputs
Gross Retail Price -> $88
Discount Rate -> 4%
Return Rate -> 3%
COGS Rate -> 32%
Processor Rate -> 2.7%
Fulfillment / Unit -> $4.50
Units / Order -> 1.25
Shipping Revenue / Order -> $6.00
Shipping Expense / Order -> $8.50
Derived
Average Order Value -> $108.43
Total Variable Costs -> $51.75
Profit / Order -> $56.68
Profit Margin % -> 52.3%
Profit per Order here is $56.68. The rest of the model builds on it.
The Funnel Between Click And Purchase
Two steps sit between a click and an order: adding to cart, then completing checkout. The Store Funnel panel sets a target for each, and together they derive the click-to-order conversion rate.
| Input | What it means |
|---|---|
| Target ATC Rate % | Of the paid clicks that land on your store, what percentage will add something to cart? Healthy starting target: 8-10%. |
| Target Checkout Rate % | Of the people who added to cart, what percentage will actually complete checkout? Healthy starting target: 30-40%. |
| Derived metric | What it tells you |
|---|---|
| Clicks / ATC | How many ad clicks you need to produce one cart. At an 8% ATC rate, that's 12.5 clicks per cart. |
| ATCs / Checkout | How many carts you need to produce one order. At a 35% checkout rate, that's about 2.9 carts per order. |
| Checkout / Click | The overall click-to-order conversion rate, which Meta delivery runs against. Healthy starting target: 1-5%. |
Why Conversion Carries So Much Weight
At $1.50 a click and a 2% click-to-order rate, an order costs $75, near the $56.68 ceiling. At 4% conversion the same traffic produces an order for $37.50, with no change to price, supplier, or ads.
What You Can Afford To Pay Meta
This is where Profit per Order meets cost per purchase. With an order worth $56.68 and a store converting around 2.8%, the Meta inputs decide what you pay for traffic and whether the chain still ends in profit.
| Input | What it means | Healthy starting target |
|---|---|---|
| Target CPM | What you'll pay Meta per 1,000 impressions. | $15-$25 (varies by industry and audience saturation). |
| Target CTR % | Click-through rate, the percentage of impressions that produce a click. Driven entirely by your creative. | 1.5-2.5%. |
| Target Conversion % | Orders per paid click. This should equal the click-to-order rate from your funnel section. If it doesn't, something's off in the inputs. | 1-5%. |
| Target Orders / Day | Your daily volume goal. Drives total ad spend and monthly rollups. | Start small. 2-5 orders/day is a real testing baseline. |
What The Ad Metrics Mean
CPP (cost per purchase) is the one that decides whether the model makes money: it has to land below Profit per Order.
| Derived metric | What it tells you | How to read it |
|---|---|---|
| CPC | Cost per click. What you pay for one click, from your CPM and CTR. | If this runs well above $2.00 on cold, broad traffic, your clicks are expensive, usually a creative or targeting issue. |
| CPP | Cost per purchase. CPC divided by Conversion rate. The number that decides viability. | Has to be less than Profit/Order. If it isn't, the model loses money on every sale. |
| CM / Order | Contribution Margin per order. Profit/Order minus CPP. What you actually keep after ads. | If this is positive, you have a viable model. If it's negative or zero, the order loses money or breaks even at best. |
| ROAS | Return On Ad Spend. AOV divided by CPP. | Doesn't include the cost of fulfilling the order; CM/Order does. |
| ROI | Return On Investment. Profit/Order minus CPP, divided by CPP. The percent return on each dollar of ad spend. | A reasonable testing target is 30%. Higher than that and you're throttling delivery. |
Why 30% ROI Is A Reasonable Early Target
Aiming for higher ROI early tends to work against the business.
Skill: on early campaigns the creative isn't refined, the funnel isn't tuned, and the converting persona is unknown. A 30% target leaves room to learn before the math demands perfection.
Delivery: higher ROI is usually pursued with tight bid caps or narrow audiences, both of which limit Meta's delivery. Andromeda needs auction room to find efficient buyers; constrained too far, it spends less and stalls. Day-one targets of 100%+ often produce campaigns that look efficient but never scale past about $30 a day.
Reasonable CPC By Price Point
| AOV range | Typical workable CPC |
|---|---|
| $30 - $50 | $0.50 - $1.00 |
| $50 - $150 | $1.00 - $2.00 |
| $150 - $400 | $1.50 - $3.00 |
| $400+ | $2.00 - $5.00, and conversion rate has to do more of the work |
These are ranges, not rules; some categories sit outside them. A model assuming a $0.40 click on a $400 product points to an error in the assumption or the strategy.
How Strictly To Grade
Most results land between a clean hit and a clean miss. The tolerance thresholds decide when the gap is large enough to act on.
| Grade | What it means | What to do |
|---|---|---|
| Met | You hit or beat your target. | Scale or sustain. Find what's working and lean in. |
| On track | You missed by 10% or less. | Almost certainly noise. Let it run another week before changing anything. |
| Near goal | You missed by 10-20%. | Worth investigating. Look for one specific thing to change. Don't overhaul the whole campaign. |
| Miss | You missed by more than 20%. | The plan and reality have diverged enough that something real is happening. Kill, replace, or restructure. |
Why The Tolerances Exist
Day-to-day swings of 15-25% on a small ad set are normal: the auction is probabilistic and the sample is small. Tolerance bands separate that noise from a real result, so a single bad day doesn't end a working ad set.
Three Ways To Fix The Math When It Doesn't Work
When the numbers don't close (say Profit per Order at $32 against a $45 CPP, with negative CM), move one of these:
- Lower the cost to make a unit.
- Lower the cost to get a sale.
- Raise the price of a unit.
Option 2 gets reached for most often, but 1 and 3 usually move more profit with less risk.
Lower The Cost To Make A Unit
Same revenue and ad spend, lower COGS.
Lower supply cost, all else equal
$100 revenue, $60 cost -> $40 gross profit, $40 CPP, $0 CM (broken)
$100 revenue, $40 cost -> $60 gross profit, $40 CPP, $20 CM (alive)
$100 revenue, $20 cost -> $80 gross profit, $40 CPP, $40 CM (scaling)
Sources of savings: manufacturer terms once volume supports them, packaging (a $1.20 insert is $14,400 a year at 1,000 orders a month), freight, or a lower-cost 3PL if fulfillment runs above 5% of AOV.
Lower The Cost To Get A Sale
Lower CPP, all else equal
$100 revenue, $20 cost -> $80 gross profit, $80 CPP, $0 CM
$100 revenue, $20 cost -> $80 gross profit, $40 CPP, $40 CM
$100 revenue, $20 cost -> $80 gross profit, $10 CPP, $70 CM
CPP comes down through better creative (higher CTR and conversion), better persona-creative match, better store conversion, broader targeting (lower CPMs), and time as the algorithm learns. The controls inside Meta, like bid caps and narrow targeting, usually raise CPP rather than lower it.
Raise The Price Of A Unit
Added price falls mostly to the bottom line, since variable costs rise far less than 1:1 with price.
Raise the price, all else equal
$100 revenue, $20 cost -> $80 gross profit, $40 CPP, $40 CM
$120 revenue, $20 cost -> $100 gross profit, $40 CPP, $60 CM
$150 revenue, $20 cost -> $130 gross profit, $40 CPP, $90 CM
Raise effective price without a higher sticker:
- Bundle. A $30 single becomes a $65 starter pack: higher AOV, more units per order, fulfillment rising less than revenue.
- Free-shipping threshold. "Free shipping over $50" on a $42 cart lifts AOV without changing the headline price.
- Spend-and-get. A gift or 10% off at $75; the incentive's cost is small against the AOV lift.
Starting Targets
A reference table for the common numbers. For ranges tuned to your industry, apply Reference goals in the Goal Editor (or set a Store Type on the Connections tab), and it fills these in for you.
| Metric | Healthy starting target | Why |
|---|---|---|
| New customer AOV | >= $40 | Below this, ad math gets very tight at any reasonable CPC. If you're under $40, bundle. |
| Gross margin (variable basis) | 60-75% | Leaves enough room for ads, returns, processor fees, and the rest. Lower than 50% rarely scales profitably on paid acquisition alone. |
| Click-to-order conversion rate | 1-5% | Below 1% the funnel is broken. Above 5% on cold traffic is rare and worth investigating (often a tracking artifact). |
| ATC rate | 8-10% | Below this you're losing buyers on the product page; investigate page layout, price perception, trust signals. |
| Checkout rate (ATC -> order) | 30-40% | Below this you're losing buyers at the checkout step; investigate shipping costs, account requirement, payment options. |
| CPM | $15-$25 | Higher on saturated audiences (beauty, finance); lower in less competitive verticals. Track your CPM trend more than the absolute number. |
| CTR | 1.5-2.5% | The most controllable input. Driven by creative quality. |
| ROI on ad spend | >= 30% (early) | Higher targets throttle delivery. Earn your way to tighter targets over months, not days. |
These are gut-check ranges, not laws; luxury, very high AOV, and mature subscription models sit outside them. A model assuming day-one performance well beyond these points to an assumption worth rechecking.
If You Remember Nothing Else
- Each order should be profitable on its own. A first order that clears its variable costs doesn't depend on lifetime value that hasn't happened yet.
- CPP above Profit per Order means the model loses money per sale. The fix is an input (price, supply cost, or store conversion), not a campaign tactic.
- A working model beats a perfect one. The first version will be wrong somewhere; real data shows which input to correct.
The same model carries through the rest of the series: research, strategy, creative, and the first campaign all read off the targets set here.